I have a Polar 720Si that I have been using for some years now. Check out the graphs of my Tuesday night training and the Hakuba hill climb. The graphs speak for themselves mostly and I use similar graphs of race data (races I’ve already done once) and simulate the same heart intensity on my indoor roller for the next year’s race.
Red = Heart, Blue = Speed, Brown = Altitude, Green = Cadence
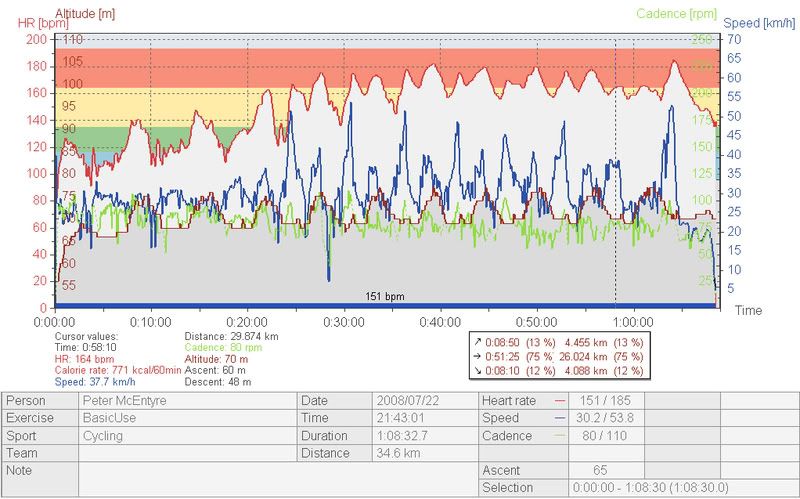 On Tuesday night’s about six or seven of us do a 3.1km loop around a park that has a 900m hill at the start. We do a few warm up laps and a few sprints then at the end one last sprint to end. This takes about an hour. I normally do about 10kms warm up even before this.
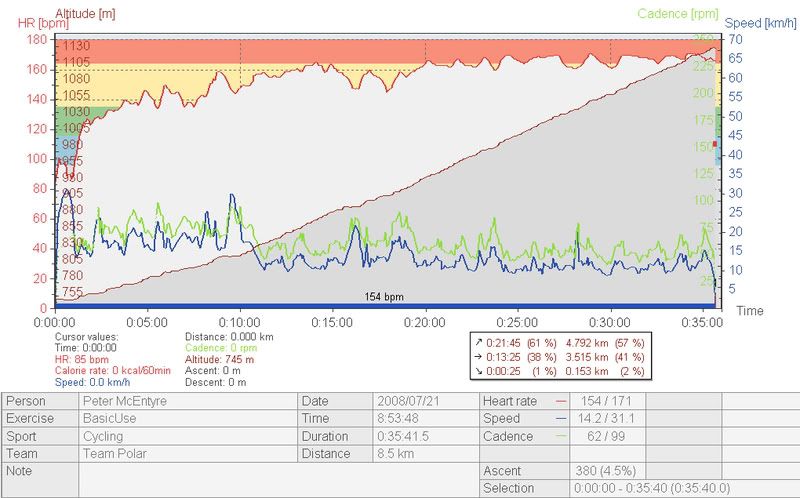
You can see we climb at a steady pace by the brown line. The descent shows a much steeper line as we are going faster. I may put that up as well too later.
My race cadence used to be around 98 and I’ve noticed lately that my average cadence has dropped a lot. The hill climb was going to be low anyway but the Tuesday night one should be 100rpm or more but it’s only showing 80. I’m going to concentrate on improving my cadence a lot more from now on until my next race.